As technology continues to revolutionize education, educators are constantly seeking innovative ways to enhance their teaching and simplify administrative tasks. Google Sheets, a versatile spreadsheet tool, offers a powerful feature called conditional formatting that can revolutionize the way educators organize and analyze data. Let’s explore why teachers will want to learn how to leverage conditional formatting in Google Sheets, and how conditional formatting can significantly streamline our work and improve student outcomes.
Visualize Data at a Glance:
Teachers deal with vast amounts of data, ranging from grades, attendance records, and student performance metrics. Conditional formatting allows us to visually highlight patterns, trends, and discrepancies in data. By applying formatting rules, such as color scales or data bars, we can quickly identify areas that require attention, making data analysis faster and more efficient.
Engage Students with Interactive Feedback:
Conditional formatting can be a powerful tool to provide instant feedback and engage students in the learning process. By applying conditional formatting to assessments or assignments, we can highlight correct and incorrect answers, facilitating self-assessment and encouraging students to reflect on their work. This immediate feedback fosters a sense of ownership and motivates students to improve their performance.
Identify Student Progress and Intervention Needs:
With conditional formatting, we can set up rules to automatically highlight areas of concern or progress within large datasets. By assigning specific formatting to different performance levels or benchmarks, we can easily identify struggling students or those who require additional challenges. This targeted intervention approach enables educators to personalize instruction, saving valuable time and ensuring no student falls through the cracks.
Enhance Data Visualization for Presentations:
Teachers often need to present data in a visually appealing and understandable format. With conditional formatting, we can create dynamic charts and graphs that update automatically as the underlying data changes. This feature is particularly useful when sharing student progress reports with parents, administrators, and/or during parent-teacher conferences, making it easier to communicate complex information effectively.
All Play No Work
One of our favorite conditional formatting activities is from Eric Curts. Check out his article for creating color-by-number images using Conditional Formatting. After they try one of your projects, ask students to create their own!
How to use Conditional Formatting:

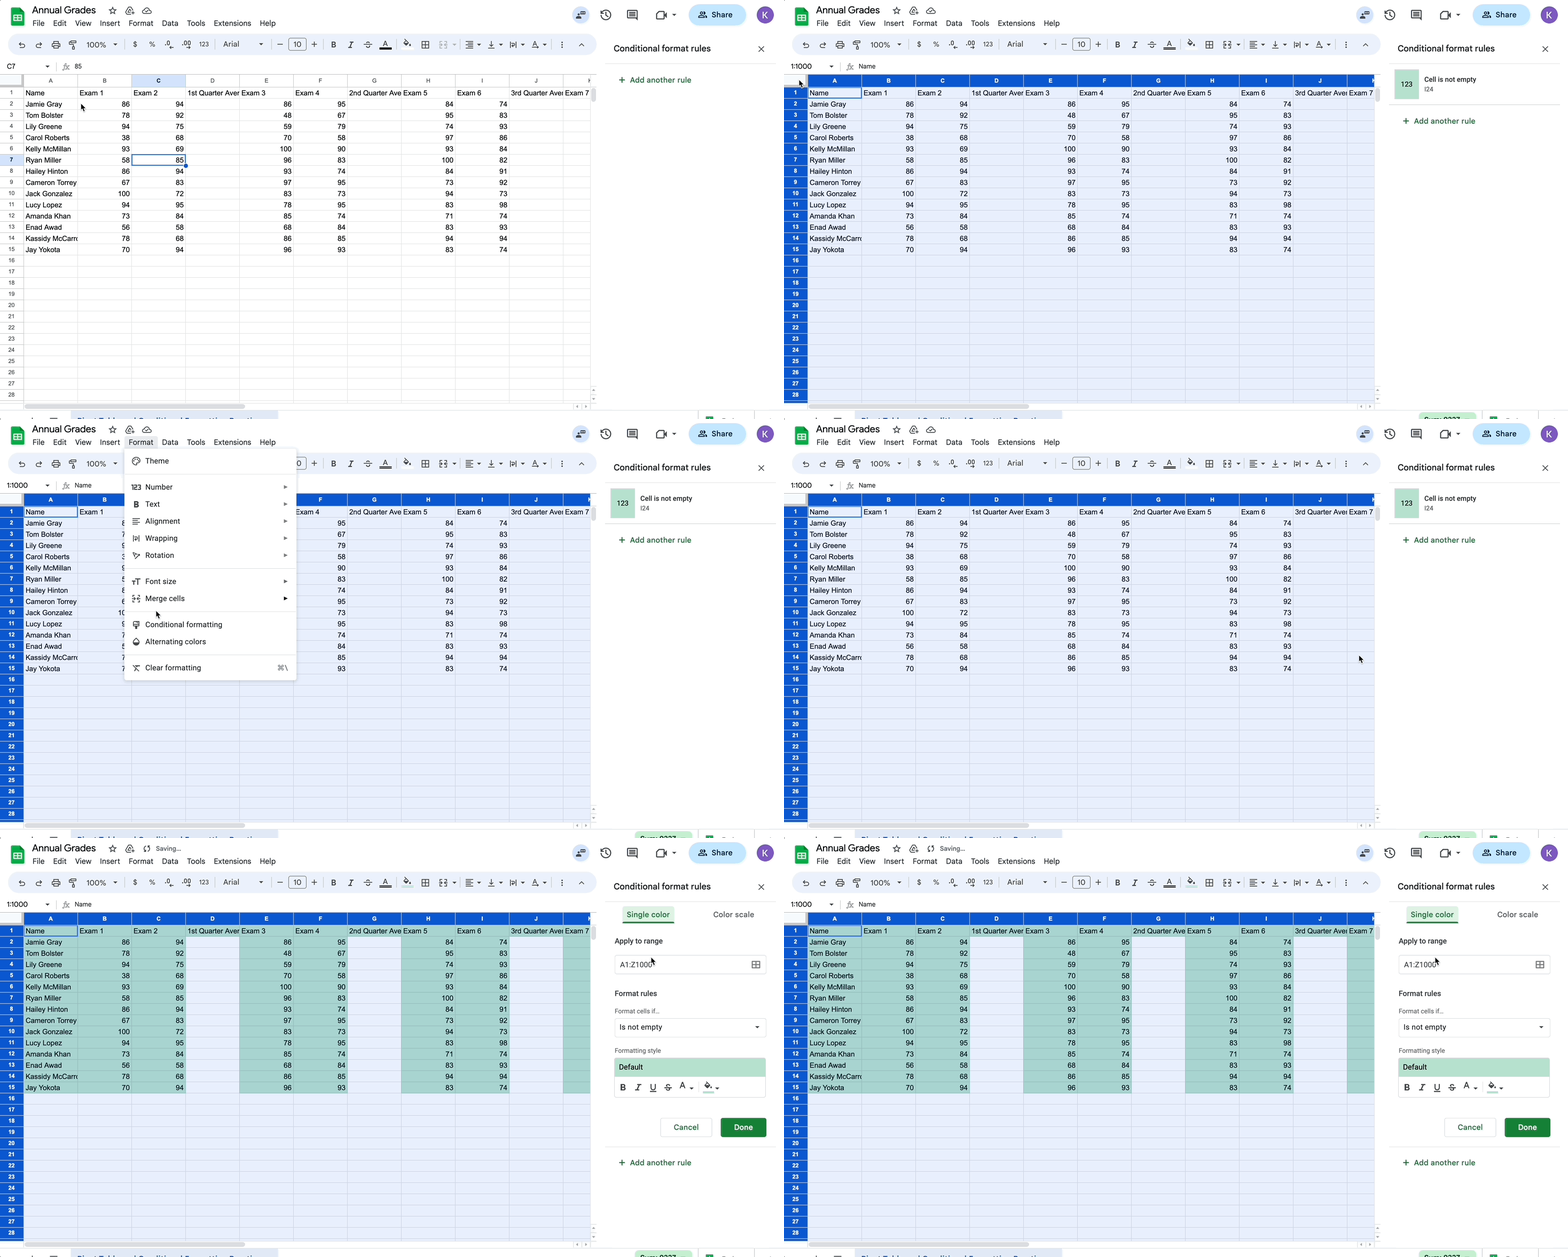
- Select the cells you want to format.
- Click on the Format menu and select Conditional formatting.
- In the Conditional formatting rules manager dialog box, select the type of formatting you want to apply.
- In the Format cells if section, specify the condition that you want to use to trigger the formatting.
- In the Formatting style section, select the formatting options you want to apply.
- Click on the OK button to apply the formatting.
Conclusion:
Don’t let your boring spreadsheets sit there like wallflowers at a dance. Dive into the world of conditional formatting and unleash the power of visualized data and ignite student engagement. Let’s get formatting, folks!


