Are you ready to take your teaching game to the next level? Forget the days of old-fashioned graphs and tedious calculations on paper. It’s time to embrace the power of technology and introduce Google Sheets charts into your classroom. In this article, we’ll dive into the exciting reasons why teachers will want to tap into the magic of data visualization and empower their students with the wonders of Google Sheets charts. Get ready to witness a whole new level of engagement and excitement in your classroom!

Bring Data to Life:
Gone are the days of dry statistics and endless numbers on a page. Charts offer a visually captivating way to present data to your students. With colorful graphs, charts, and diagrams, you can transform dull information into something captivating and memorable. Whether it’s showcasing historical trends, analyzing scientific experiments, or exploring mathematical concepts, charts breathe life into data, making it easier for students to understand and remember.
Foster Data Literacy:
In today’s data-driven world, teaching students to analyze, interpret, and communicate data effectively is an essential skill. By using Charts, you can nurture data literacy in your students. They can learn how to collect, organize, and visualize data, as well as critically analyze the information presented. With Charts, your students will become proficient in understanding and presenting data, equipping them with valuable skills for their future endeavors.
Interactive Learning Experiences:
Charts offer more than just static images on a screen. They can be interactive learning tools that promote engagement and participation. Students (on their own or in a team) can actively manipulate data and observe real-time changes in the charts. Imagine the excitement as they experiment with different variables and instantly witness the effects on the graphs! By encouraging hands-on exploration, Charts turn learning into an immersive adventure, making the classroom come alive with curiosity and discovery.
Maps Charts:
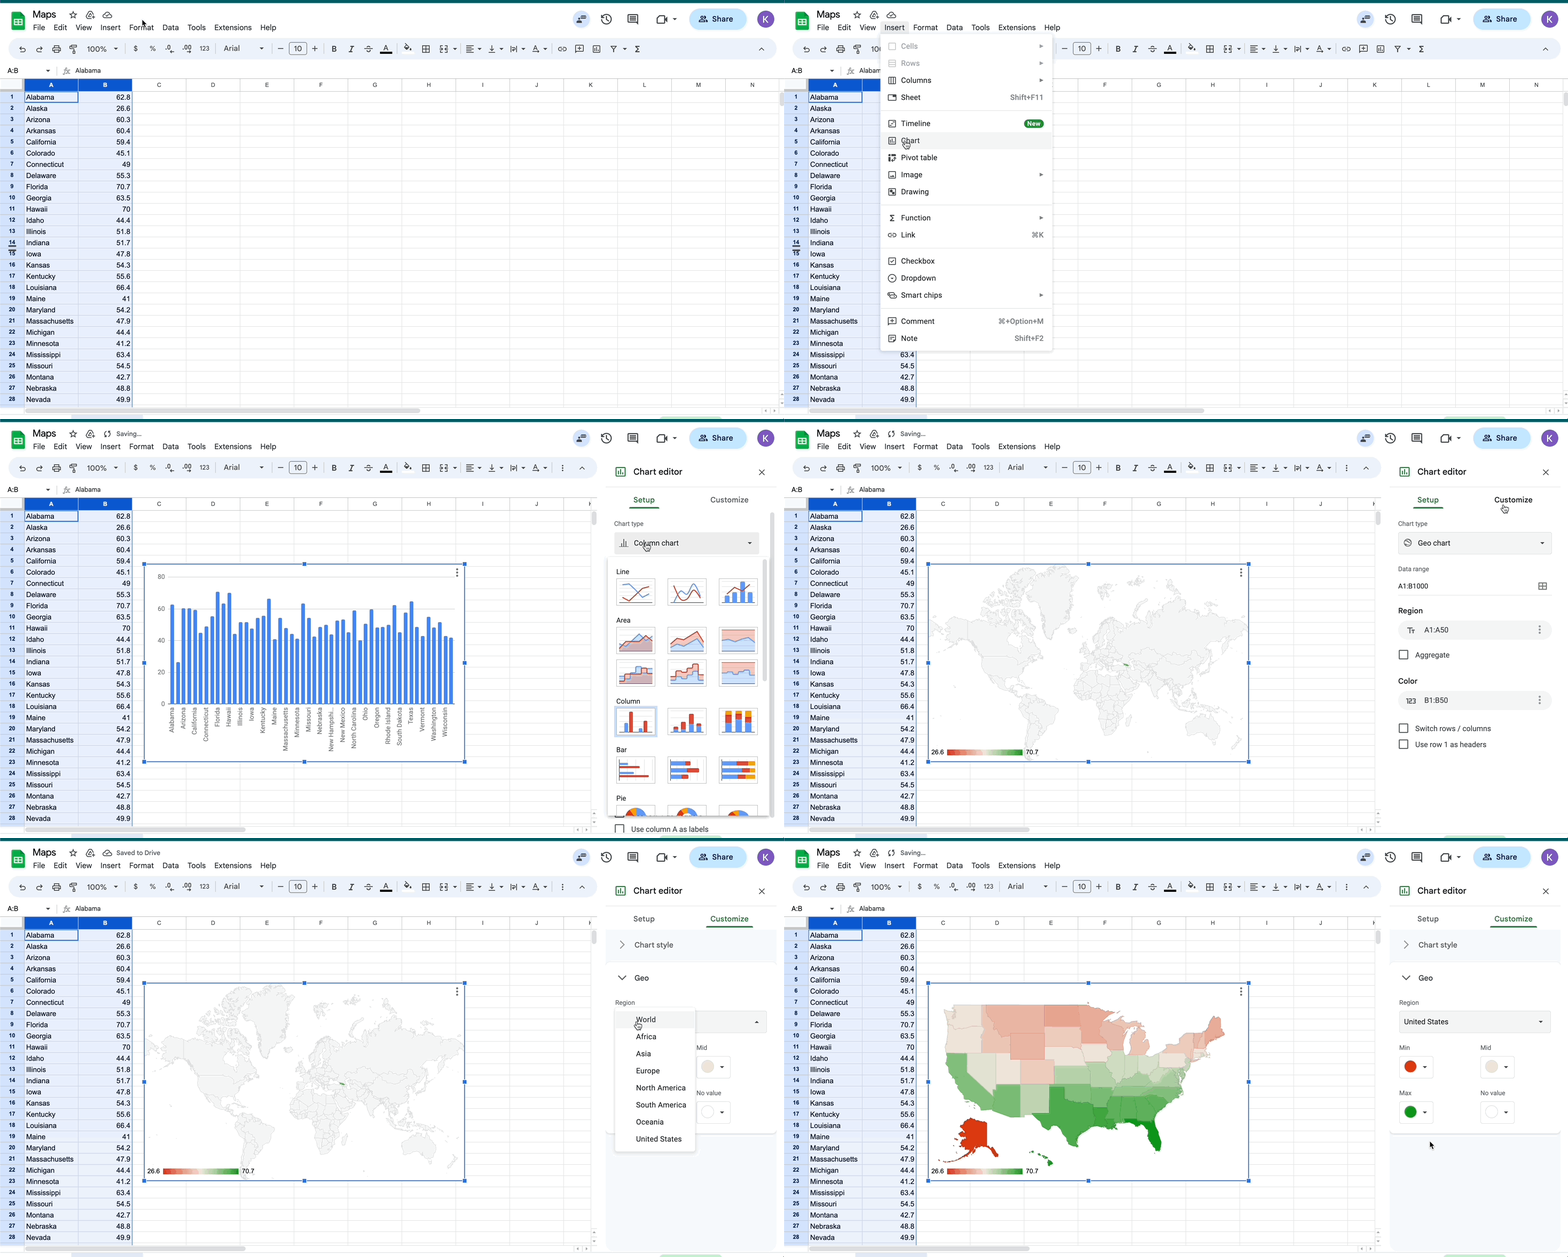
One of my favorite Charts to use in Google Sheets is the Map option. All you need is data tied to a state, country, continent, sea, etc and Sheets will place the data on a map for you. Check out this video tutorial by Flipped Classroom tutorials for an awesome how-to.
Customization and Creativity:
One of the best aspects of Google Sheets charts is the ability to customize and get creative with data visualization. Students can experiment with various chart types, colors, fonts, and layouts to create visually appealing presentations. This customization allows them to express their individuality and creativity while effectively communicating their findings. Whether they prefer a bar graph, a pie chart, or a scatterplot, students can unleash their imaginations and make data visualization an art form!
Integrating charts into your classroom will revolutionize the way students interact with data. By harnessing the power of data visualization, you’ll enhance their understanding, foster collaboration, and nurture vital skills for the future. So, why stick to traditional graphs and charts when you can open up a world of interactive learning experiences with charts in Google Sheets? Embrace this technological wonder and embark on an exciting journey with your students. Get ready to transform numbers into captivating stories and turn your classroom into a data-driven paradise!

